
What Are the Most Useful kubectl Commands?
The most useful kubectl commands are get, describe, logs, exec and rollout, read together with the cluster’s Events, because they show what’s wrong before you change anything. This kubectl cheat sheet follows the free PDF, a 23-page troubleshooting runbook built on them, and adds the flags, version notes and Kubernetes documentation the PDF leaves out.
| Command | What it shows | Use it when |
|---|---|---|
kubectl get pods -A -o wide | Status, restarts, node and IP | First look at any incident |
kubectl describe pod <pod> -n <ns> | Conditions, Last State, Events | The status isn’t Running |
kubectl logs <pod> -n <ns> --previous | Output of the crashed container | CrashLoopBackOff |
kubectl get events -n <ns> --sort-by=.lastTimestamp | Scheduling, image and probe events | Pods are Pending or failing |
kubectl top pods -A --sort-by=memory | Live CPU and memory use | You suspect an OOM kill |
kubectl get endpointslices -n <ns> | Ready backends behind a Service | Traffic never arrives |
kubectl exec -it <pod> -n <ns> -- sh | A shell inside the container | Testing ports, DNS or config |
kubectl rollout undo deployment/<name> | Rolls back one revision | A release went bad |
kubectl auth can-i <verb> <resource> | Allowed or denied | You get a Forbidden error |
kubectl drain <node> --ignore-daemonsets | Evicts Pods from a node | Node maintenance |
How Do You Check and Switch kubectl Context Safely?
Run kubectl config current-context before every change, because kubectl acts on whichever cluster the current context points at. The PDF opens its triage set with the same check.
kubectl config current-context
kubectl config get-contexts
kubectl config use-context <context>
kubectl config set-context --current --namespace=<ns>
kubectl version
kubectl version prints the client and server versions. Keep them close: the version skew policy supports kubectl one minor version older or newer than the API server. Every other everyday command is in the official kubectl quick reference.
Kubernetes Troubleshooting Workflow: kubectl logs, Describe and Events
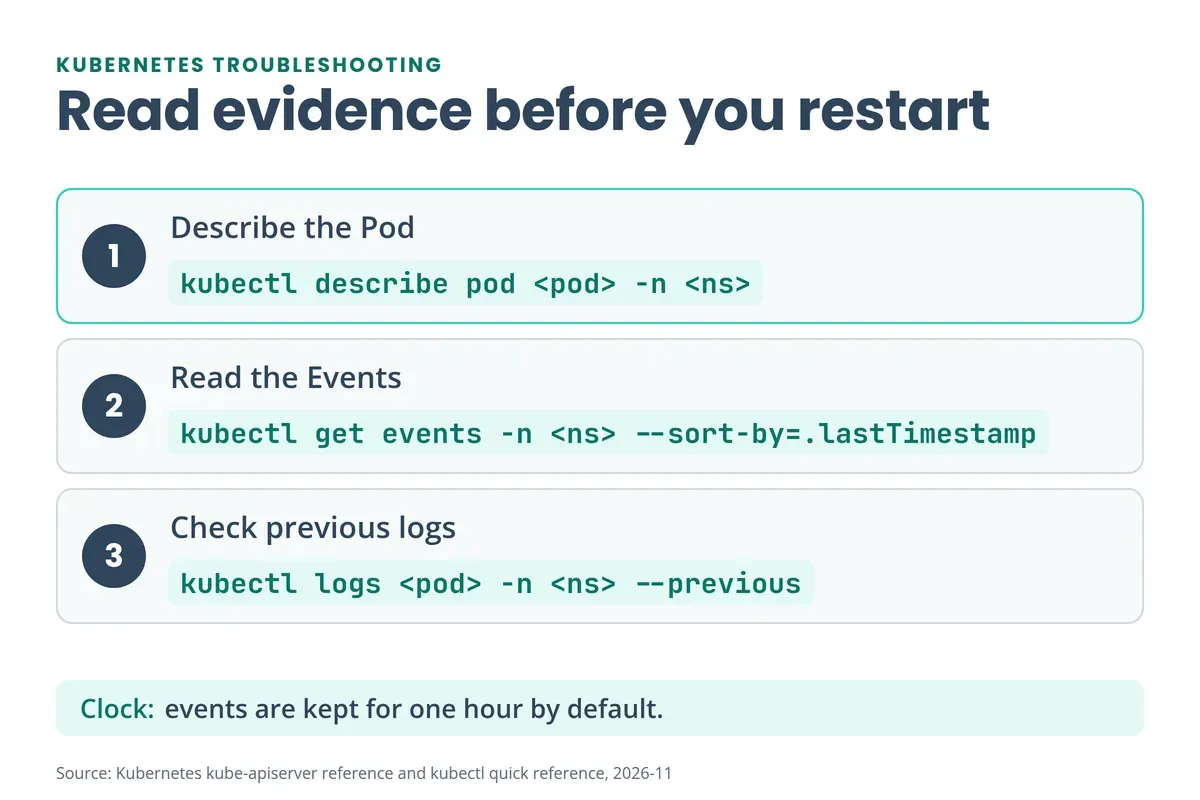
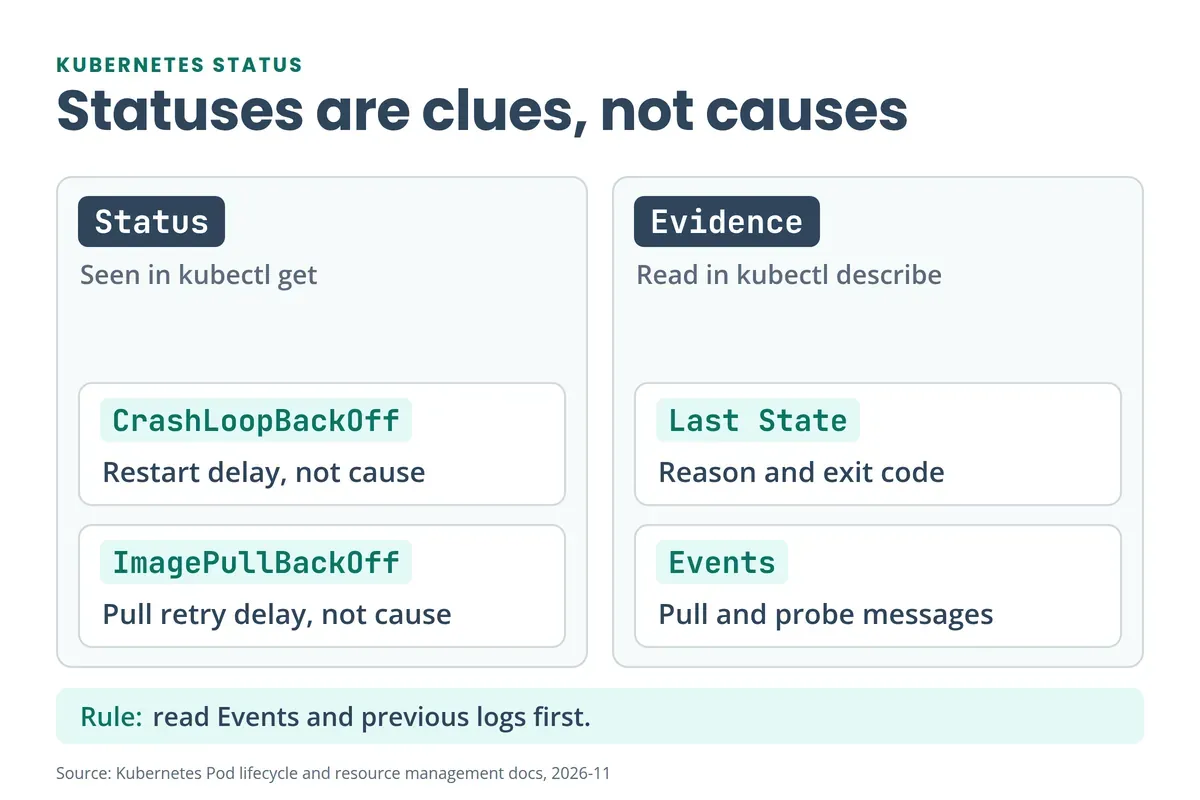
Troubleshoot in this order: describe, events, logs, metrics, dependencies, then change history. A Pod status is a clue, not a root cause. Collect evidence before you restart anything, because Kubernetes keeps events for one hour by default (the kube-apiserver --event-ttl flag, default 1h0m0s) and deleting a Pod loses its previous logs.
kubectl describe pod <pod> -n <ns>
kubectl get events -n <ns> --sort-by=.lastTimestamp
kubectl logs <pod> -n <ns> --all-containers
kubectl logs <pod> -n <ns> --previous
Four kubectl logs flags do most of the work: --previous (the last crashed instance), -c <container> (one container in a multi-container Pod), -f (stream) and -l app=<name> (every Pod with that label). In kubectl describe, read Events at the bottom first, then Last State, Reason and Exit Code. The PDF’s runbook template makes you record eight things: symptom, scope, recent changes, evidence, root cause, fix, validation and prevention. For the “recent changes” row, our Git commands cheat sheet covers the history side.
How to Fix CrashLoopBackOff in Kubernetes
CrashLoopBackOff means a container keeps exiting and the kubelet is waiting longer before each restart. It’s a symptom, not a cause. The Pod lifecycle docs give the delay as 10s, 20s, 40s and so on, capped at 5 minutes, reset after the container runs 10 minutes without problems.
The usual causes: the app exits on startup, a bad command or argument, a missing ConfigMap, Secret or variable, a dependency that’s down or rejects credentials, a liveness probe that kills a slow starter, or an OOM kill.
- Read
kubectl logs <pod> --previous. Current logs may show only the newest attempt. - Run
kubectl describe pod <pod>and read Last State, Reason, Exit Code and Restart Count. - Check the command, args,
envFrom, ConfigMaps, Secrets and mounted files. - Test the dependency from the same network context.
- Review probe thresholds and resource limits.
Exit code 1 alone isn’t a root cause. You’re done when the restart count stops rising and readiness passes.
Exit Code 137 and OOMKilled: What They Mean and How to Fix Them
Exit code 137 means the container was killed with SIGKILL. Shells report 128 plus the signal number, and SIGKILL is signal 9 (Bash manual). The usual cause is the out-of-memory (OOM) killer, and kubectl describe pod confirms it:
Last State:     Terminated
  Reason:       OOMKilled
  Exit Code:    137
That’s the output shown in the Kubernetes resource management docs. Memory limits are enforced by the kernel, which may terminate a container that exceeds its limit once it detects memory pressure. Exit 137 without OOMKilled can also mean a container ignored SIGTERM, because the kubelet sends SIGKILL once the grace period expires.
Measure before you change the limit: kubectl top pod <pod> -n <ns> --containers may fail if metrics-server is unavailable, so use Prometheus or CloudWatch then. Set the limit from the measured peak plus headroom. Raising it without checking node capacity can move the failure to the node. For Java, container memory isn’t the same as heap size.
How to Fix ImagePullBackOff and ErrImagePull
ErrImagePull is the failed pull, and ImagePullBackOff means Kubernetes is delaying retries. Read the Event message first: NotFound, unauthorized, timeout, TLS or rate limit. The Kubernetes debugging guide lists the first three checks: is the image name correct, was it pushed, and can it be pulled by hand.
kubectl describe pod <pod> -n <ns>
kubectl get pod <pod> -n <ns> -o jsonpath='{.spec.containers[*].image}'
kubectl get pod <pod> -n <ns> -o jsonpath='{.spec.imagePullSecrets[*].name}'
Then check the tag or digest, the pull Secret (how to pull from a private registry), and node egress, DNS, proxy and certificate trust. Try docker pull from your own machine first; our Docker commands cheat sheet lists it. An imagePullSecret doesn’t fix every private-image failure. On EKS, node IAM permissions for ECR and network reachability can fail too, so read Amazon EKS troubleshooting. Never paste credentials into chat or logs.
Why Is My Pod Stuck in Pending?
A Pending Pod hasn’t been scheduled, or a volume prerequisite is still unmet. The FailedScheduling event in kubectl describe pod names the constraint. Kubernetes lists exhausted CPU or memory and hostPort limits. The PDF adds node selectors, affinity, taints, an unbound PVC, quota, and an autoscaler that can’t add capacity.
kubectl describe pod <pod> -n <ns>
kubectl describe nodes
kubectl get pvc -n <ns>
kubectl get resourcequota,limitrange -n <ns>
Compare the Pod’s requests with each node’s allocatable resources, then check its tolerations against the node taints. Don’t lower requests just to force scheduling. Validate the app’s real needs and capacity headroom first.
Pod Running but Not Ready: Readiness, Liveness and Startup Probes
A Pod that’s Running but not Ready is usually failing its readiness probe, so Kubernetes keeps it out of Service endpoints. It doesn’t restart the container. A failing liveness probe does.
| Probe | Job |
|---|---|
| Readiness | Decides whether the Pod receives Service traffic |
| Liveness | Restarts a stuck container |
| Startup | Gives a slow starter time before liveness checks begin |
The probe configuration guide covers all three. Test the exact health endpoint from inside the container:
kubectl exec <pod> -n <ns> -- sh -c 'wget -S -O- http://127.0.0.1:<port>/<path>'If the image has no shell or wget, use kubectl debug (below). Set thresholds from measured start time, not guesswork.
Service Has No Endpoints: Check Selectors With kubectl get endpointslices
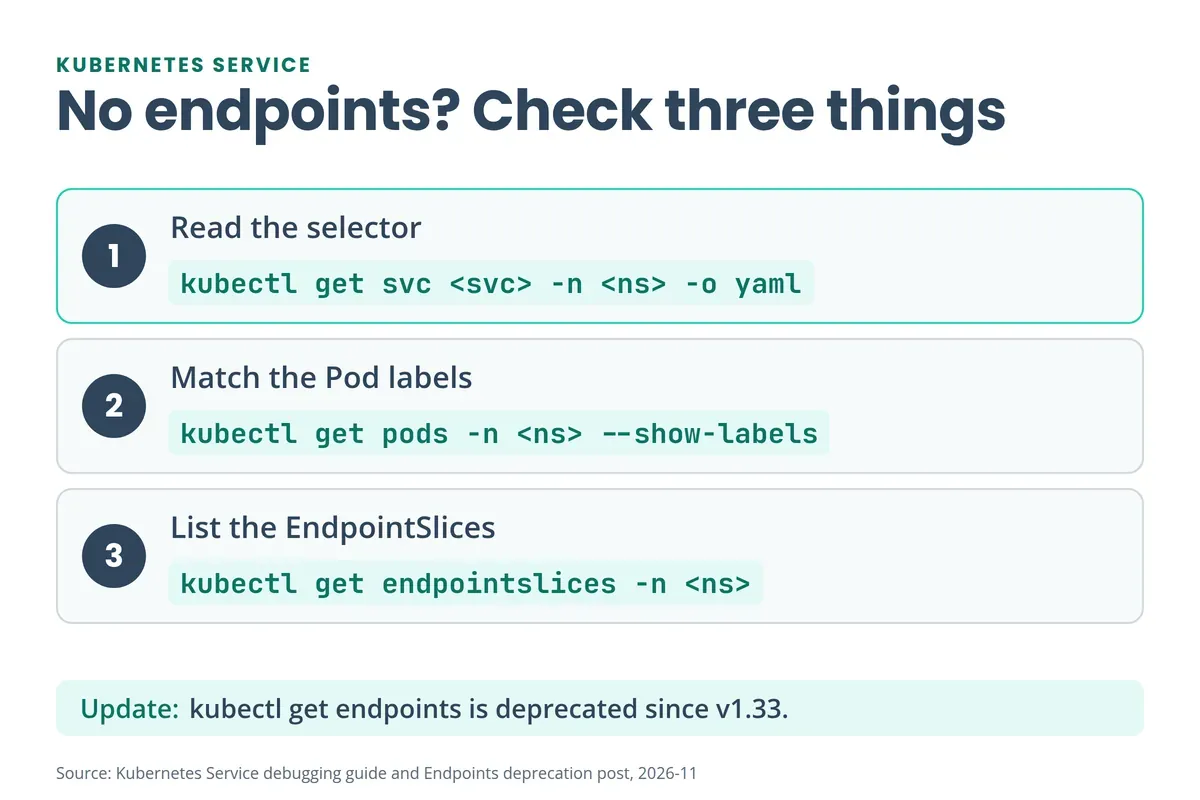
A Service with no endpoints usually has a selector that doesn’t match the Pod labels, or its Pods aren’t Ready. A Service can exist and resolve in DNS while having no usable backends, so check endpoints before you debug a load balancer.
kubectl get svc <svc> -n <ns> -o yaml
kubectl get pods -n <ns> --show-labels
kubectl get endpointslices -n <ns> -l kubernetes.io/service-name=<svc>
If the ENDPOINTS column says <none>, compare spec.selector with the labels, then check port, targetPort and the port the app really listens on. The Service debugging guide walks the same path. One update: the Endpoints API has been deprecated since Kubernetes v1.33 (see the Kubernetes announcement), so kubectl get endpoints prints a warning. The PDF lists both commands, and EndpointSlices are the one to learn.
DNS, NetworkPolicy and Ingress: Where Does Traffic Stop?
Trace one request hop by hop: client, DNS, load balancer, Ingress, Service, EndpointSlice, Pod. Test each layer from a client Pod in the same namespace.
| Layer | First check | Usual cause |
|---|---|---|
| DNS | kubectl exec <pod> -n <ns> -- nslookup <svc>.<ns>.svc.cluster.local | CoreDNS unhealthy, or UDP/TCP 53 blocked |
| NetworkPolicy | kubectl get networkpolicy -A | Default-deny with no DNS egress rule |
| Ingress | kubectl describe ingress <name> -n <ns> | Wrong class, host, path or TLS Secret |
CoreDNS Pods in kube-system carry the label k8s-app=kube-dns, so kubectl logs -n kube-system -l k8s-app=kube-dns reads them. DNS uses port 53 over UDP and TCP, as our common ports cheat sheet explains, and the network troubleshooting commands PDF covers nslookup and dig. If only one app fails, check its resolver library before blaming CoreDNS. NetworkPolicies are additive for allowed traffic, so read every policy that selects the source and destination Pod. Don’t delete all policies as a quick fix. Add the narrowest allow rule.
kubectl exec, port-forward and debug: Get Inside a Failing Pod
kubectl exec runs a command inside a container, and kubectl debug adds a throwaway container when the image has no shell. They’re the Kubernetes versions of docker exec and docker logs from the Docker cheat sheet.
kubectl exec -it <pod> -n <ns> -c <container> -- sh
kubectl port-forward svc/<svc> 8080:80 -n <ns>
kubectl debug -it <pod> -n <ns> --image=busybox:1.28 --target=<container>
kubectl debug node/<node> -it --image=busybox:1.28
--target shares the process namespace of the container you name, and ephemeral containers have been stable since Kubernetes v1.25 (Debug Running Pods). kubectl debug node/<node> mounts the node’s root filesystem at /host. For a network test the PDF runs kubectl run net-debug --rm -it --image=curlimages/curl -- sh. Use an approved image and delete temporary debug Pods afterwards.
Node NotReady, DiskPressure and kubectl drain
A NotReady node isn’t reporting a healthy status. The causes are a stopped kubelet, a failing container runtime, DiskPressure, MemoryPressure or PIDPressure, or a CNI or network fault. Start with kubectl describe node <node>: Conditions and Events come first. Then, with approved access, check the node itself:
systemctl status kubelet
journalctl -u kubelet --since '30 min ago'
df -h
df -i
df -i matters because a disk can run out of inodes before bytes. Our Linux commands cheat sheet covers systemctl and journalctl. Never delete files under the container runtime directories while it’s running.
To empty a node for maintenance, cordon it, drain it, then bring it back:
kubectl cordon <node>
kubectl drain <node> --ignore-daemonsets --delete-emptydir-data
kubectl uncordon <node>
Check PodDisruptionBudgets, replica capacity and stateful workloads first, as the safely drain a node guide explains. Don’t terminate a node as your first diagnostic step.
How to Restart a Pod With kubectl (and Roll Back a Bad Rollout)
There’s no kubectl restart pod command. Use kubectl rollout restart deployment/<name> for a rolling restart, or kubectl delete pod <pod> and let the controller recreate it. A bare Pod with no controller stays deleted.
kubectl rollout restart deployment/<name> -n <ns>
kubectl rollout status deployment/<name> -n <ns>
kubectl rollout history deployment/<name> -n <ns>
kubectl rollout undo deployment/<name> -n <ns> --to-revision=<n>
Force deletion (--force) doesn’t wait for confirmation that the Pod’s processes have stopped, so avoid it for Pods that share storage (kubectl delete reference). Rollback is a mitigation, not the root cause: confirm database schema compatibility and irreversible migrations first, then fix the cause and redeploy with immutable image tags or digests.
PVC Pending, HPA Not Scaling and RBAC Forbidden
| Symptom | First command | Usual cause |
|---|---|---|
| PVC Pending | kubectl describe pvc <claim> -n <ns> | No matching StorageClass, wrong access mode, or a zone mismatch (EBS volumes are zone-bound) |
| HPA not scaling | kubectl describe hpa <name> -n <ns> | Metrics unavailable, or no CPU requests set. HPA adds Pods, not nodes |
| Forbidden | kubectl auth can-i get pods -n <ns> --as=<user> | Missing Role verb or wrong binding. On EKS, IAM and RBAC are separate layers |
Grant least privilege only. Don’t reach for cluster-admin to make an error disappear.
What’s Inside the Free Kubernetes Troubleshooting PDF?
The free PDF is 23 pages. It’s a runbook, not a tutorial, and it doesn’t teach Kubernetes fundamentals.
- 16 failure runbooks. Each one has causes, evidence commands, a numbered sequence, a production caution and a recovery check.
- A request-path table. Seven layers from client and DNS to the dependency.
- A 7-step incident flow. Acknowledge, assess, stabilise, diagnose, recover, validate, learn.
- An EKS checklist. CNI, ECR, load balancer, storage and observability.
- Five practice incidents. Plus a 12-row symptom-to-first-evidence table and 10 common mistakes.
The PDF stops where practice starts. It has no cluster to break and no manifests to fix. You’ll need a cluster: our home lab guide covers a small k3s cluster, and Proxmox vs Docker lays out a three-VM Kubernetes practice lab. To build the cluster itself from code, see Terraform vs Ansible and the Terraform commands cheat sheet. Preparing for a DevOps interview? The DevOps interview questions PDF has a Kubernetes section and a five-step debug sequence.


No questions yet. Ask the first one.