FortiGate runs on two interfaces: the GUI and the CLI. The CLI is faster for diagnostics, works when the GUI won’t load, and it’s what every FortiGate exam and job interview tests. Below are the fortigate cli commands admins reach for most, grouped by task, plus the exact syntax, pulled from Fortinet’s own FortiOS troubleshooting reference.
This is a working reference, not a full command list. Fortinet’s official CLI reference alone runs past 1,000 pages. What’s here is the subset that solves real problems: logging in, checking status, reading policy, catching traffic, and debugging a stuck connection.
How to Access CLI on FortiGate?
There are three ways to reach the FortiGate CLI:
- Console cable. Connect at 115200 bps, 8 data bits, no parity, 1 stop bit, no flow control. This works even if the unit has no network configuration yet, which is why it’s the first method on a factory-reset box.
- SSH. Once the unit has a management IP and an administrator account with SSH access, connect with any SSH client (
ssh admin@<ip>). This is the normal day-to-day method. - CLI Console widget in the GUI. FortiOS has a built-in CLI window inside the web interface (top right icon, a terminal symbol). It runs the same command set as SSH or console, useful when you’re already logged into the GUI and don’t want to open a separate session.
After logging in, every session starts at the top-level prompt. Two command families cover almost everything:
getandshoware read-only. They display status and configuration without changing anything.config,execute, anddiagnosemake changes, run actions, or dig into live system internals.diagnosecommands are generally safe to read but some (noted below) change state, so check before running them on a production box.
Basic CLI Commands Everyone Starts With
These are the basic cli commands to run first on any FortiGate, whether it’s new hardware or a unit you’ve inherited:
| Command | What it shows |
|---|---|
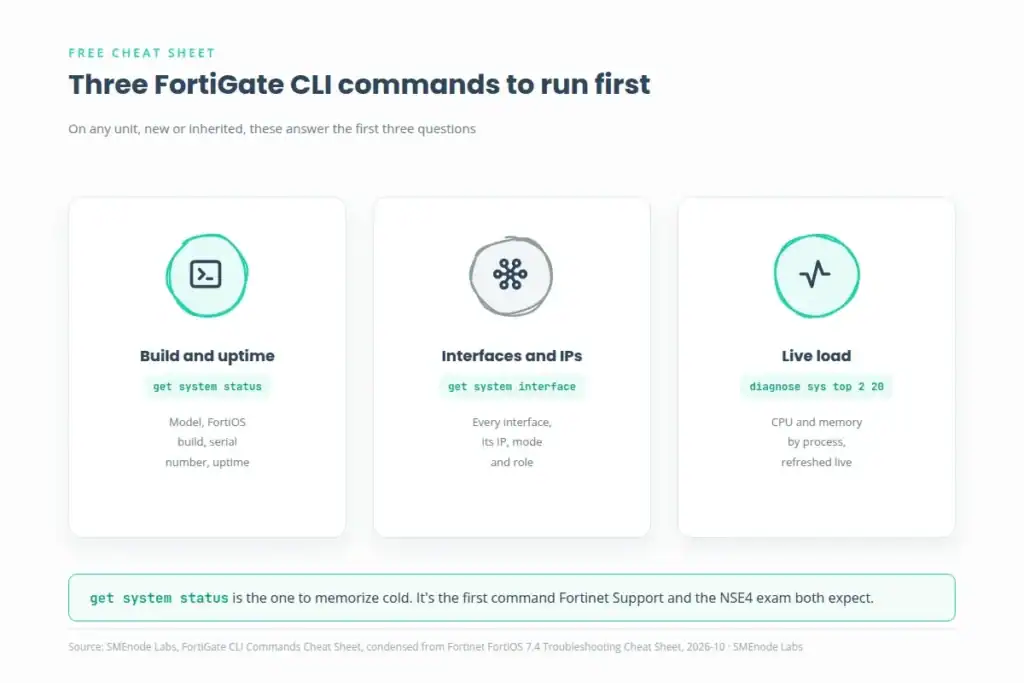
get system status | Model, FortiOS build, serial number, uptime |
get system performance status | CPU and memory load right now |
execute time | Current system time and timezone |
get system interface physical | Physical interface summary |
diagnose sys top 2 20 | Live process list, refreshed every 2 seconds, top 20 |
execute tac report | Builds the file Fortinet Support asks for on a ticket |
get system status is the one command worth memorizing cold. It’s the first thing to run on any device, and it’s the first thing any Fortinet support engineer or NSE4 exam question expects you to reach for.
FortiGate CLI Commands for Interfaces and IP Addresses
A big share of CLI get commands on FortiGate exist to answer one question: what is this interface actually doing right now. The fortigate cli show ip address job uses these:
| Command | What it shows |
|---|---|
get system interface | Full interface list with IP, mode, and role |
diagnose ip address list | Raw IP address table, useful when an interface has more than one address |
get hardware nic <interface> | Link speed, duplex, and driver-level detail for one port |
get sys interface transceiver | What SFP/transceiver is plugged into which port |
get system arp or diagnose ip arp list | The ARP table, for the fortigate cli show arp lookup |
If an interface looks fine in the GUI but traffic still isn’t flowing, diagnose hardware deviceinfo nic <interface> goes one layer deeper and shows hardware-level counters, including errors and drops the GUI summary screen won’t surface.
How to Check Policy in FortiGate Firewall CLI
Checking firewall policy from the CLI is faster than clicking through the GUI policy table once you know where to look:
show firewall policylists every policy in the current VDOM, in order. Order matters: FortiGate evaluates policies top to bottom and stops at the first match.diagnose firewall iprope listshows FortiGate’s internal firewall table, the compiled version of the policy list the hardware actually applies. Use this when the policy list “looks right” but traffic is still blocked or allowed unexpectedly.diagnose debug flow show iprope enablecombined with a flow debug (below) shows exactly which policy a specific packet is matching, live.
This is one of the fastest ways to confirm a policy problem instead of guessing. Pair it with a session filter (next section) to narrow in on one specific connection.
Session Table and Packet Sniffer Commands
These are the fortigate cli commands for watching live traffic rather than reading configuration:
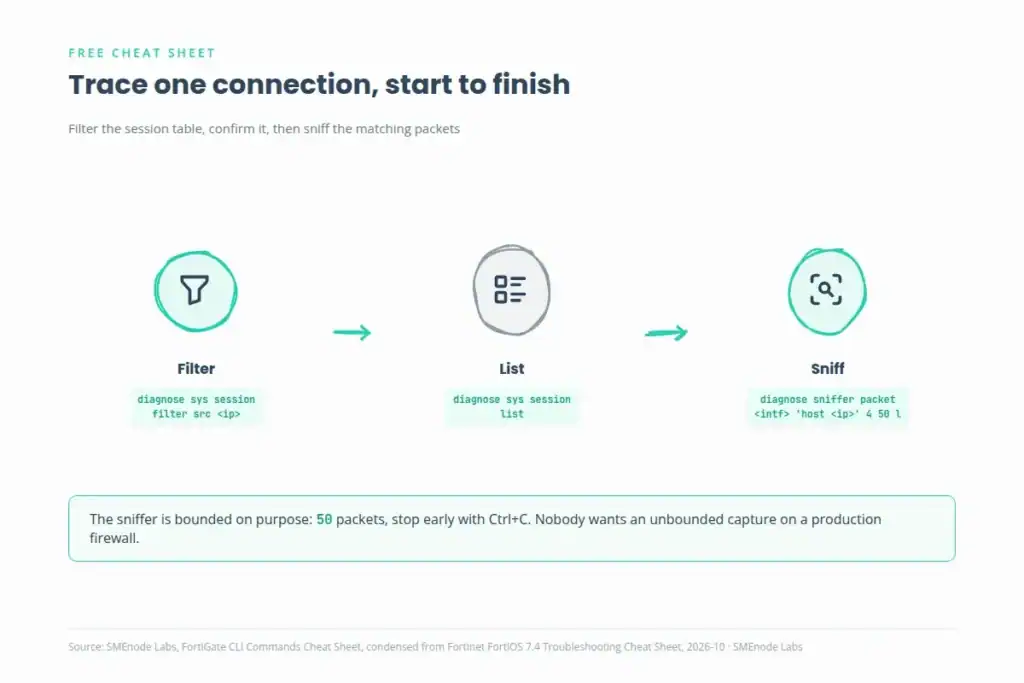
diagnose sys session filter clear
diagnose sys session filter src <client-ip>
diagnose sys session list
diagnose sys session filter clear
filter clear removes the filter. session clear (a different command) deletes the sessions outright, which can break active connections. Don’t confuse the two.
For packet-level detail, the built-in sniffer is the equivalent of a lightweight Wireshark on the box itself:
diagnose sniffer packet <interface> 'host <client-ip>' 4 50 lThis captures 50 packets on the named interface, filtered to one host, with verbosity level 4 and timestamps. Ctrl+C stops it early. It’s bounded on purpose. Nobody wants an unbounded capture running on a production firewall.
Debug and Flow Troubleshooting Commands
When policy and session checks aren’t enough, a debug flow traces the packet through FortiGate’s internal processing:
diagnose debug flow filter clear
diagnose debug flow filter <filter>
diagnose debug flow show function-name enable
diagnose debug flow show iprope enable
diagnose debug console timestamp enable
diagnose debug flow trace start 20
diagnose debug enable
Always pair diagnose debug enable with a filter first. Running an unfiltered flow debug on a busy firewall floods the console and makes the output useless. When finished, reset cleanly:
diagnose debug disable
diagnose debug reset
This two-step shutdown matters. disable stops new output; reset clears any filters or settings left behind, so the next engineer who logs in starts clean.
IPsec and VPN Diagnostic Commands
VPN issues are one of the most common FortiGate support tickets, and almost all of them start with the same two commands:
| Command | What it shows |
|---|---|
diagnose vpn ike gateway list | Phase 1 (IKE) tunnel status |
diagnose vpn tunnel list | Phase 2 tunnel status and encryption counters |
get vpn ipsec tunnel summary | Quick up/down view of every tunnel |
diagnose vpn ike log filter <filter> + diagnose debug application ike -1 | Real-time IKE negotiation debug, filtered to one peer |
If phase 1 shows as up but phase 2 won’t establish, the fix is almost always a proposal mismatch (encryption, hash, or DH group) or a selector mismatch between the two sides, not a routing problem.
What’s Inside the Full FortiGate CLI Commands Cheat Sheet PDF
The free PDF download extends this page with the sections that don’t fit cleanly into body text:
- FortiGuard update and licensing diagnostics
- Managed FortiSwitch and FortiAP commands (for FortiGate deployments with switch or Wi-Fi controllers attached)
- SD-WAN health check and link monitor commands
- Authentication testing against LDAP and RADIUS directly from the CLI
- A one-page quick reference table of every command on this page
It’s a straight PDF, no email gate.
FortiGate CLI Commands vs. the GUI: When to Use Which
The GUI is better for building a policy from scratch or reviewing a visual topology. The CLI wins for three things: speed (typing beats clicking for repeated tasks), scripting (CLI commands are the only way to automate FortiGate configuration), and depth (diagnose commands expose internals the GUI never shows, like raw session tables and hardware NIC counters). Most working FortiGate admins live in both, GUI for policy design, CLI for everything else.
Who This FortiGate Cheat Sheet Is For
This page is built for FortiGate administrators running day-to-day diagnostics, and for anyone studying toward the Fortinet NSE4 certification, where CLI fluency is tested directly. If you’re past the point of looking up individual commands and need structured, hands-on practice instead, the FortiGate NSE4 Lab Workbook is built for exactly that gap. It’s 70 labs covering every domain the FCP FortiGate 7.4 blueprint tests (policies, central NAT, IPsec and SSL VPN, security profiles, SD-WAN, HA), each with full CLI and GUI output and the mistakes candidates actually make. It maps to FortiOS 7.4 and the core policy, VPN, and security profile labs carry over directly to the newer FortiOS 7.6 exam (FCP_FGT_AD-7.6). It pairs with ready-to-use EVE-NG topologies, so there’s no licence hunting or broken VM links before your first lab. Own it once, and FortiOS updates and new lab scenarios are free for life.
New to FortiGate entirely? Start with FortiGate Default Password: Login, Reset and Recovery to get into the box for the first time, and How to Add FortiGate VM to EVE-NG if you want a free lab environment to practice these commands in before buying anything.